WheesBee integrates, in a single platform, the best databases for your research and development projects. In this insight, we have analysed the “ICT sector” considering the big data contained in the patents section.
This section has about 150 million documents with a lot of data. For each patent there is title, year of publication, inventors and applicants, abstract, full text with images, family members, cited patents and citing patents, CPC classifications and CPC text categories.
All this data is filterable, so the user can do quick and extremely simple analysis.
ICT stands for “Information and Communication Technologies”, which refers to all communication technologies enabling users to access, retrieve, store, transmit, and manipulate information in a digital form. In the last decades, it has become increasingly fundamental in every area, improving efficiency and productivity in almost all sectors.
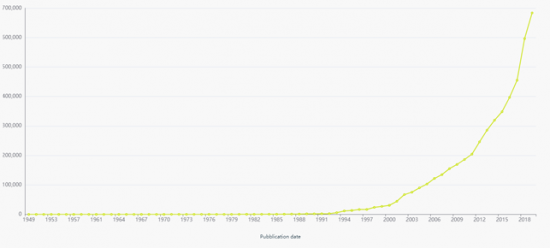
This graph shows, in fact, the number of patents related to ICT from 1949 to 2019. It can be noted the exponential growth of these technologies, since 1992.
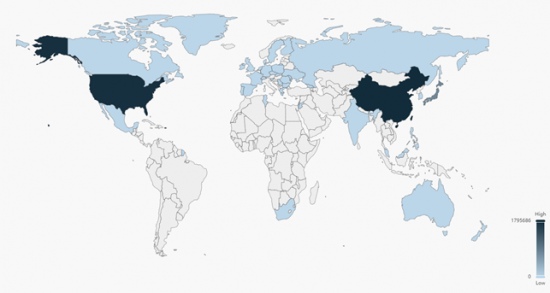
In WheesBee platform there are more than 5 million patents related to ICT sector. The following graph shows the jurisdiction of these documents.
It can be noted that China and USA have about 1,8 million patents.
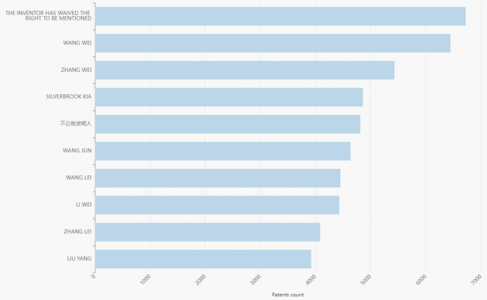
You can quickly also see who the top inventors are…
…and the top applicant:
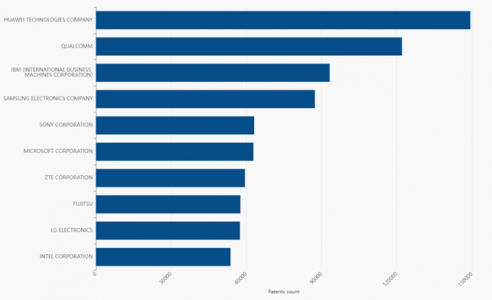
In WheesBee every patent is classified with the International CPC classification, and you can immediately have a heatmap of your query:
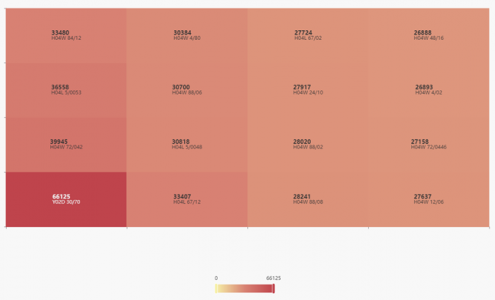
If you want to make a custom analyse, you can also export your results in Excel, CSV or RTF format.
The big advantage of this analyses is that, because of it is available a very large dataset, you can perform analysis driven by data.
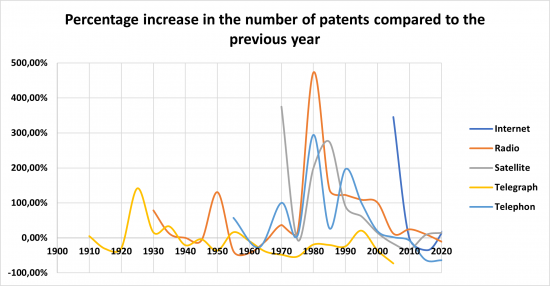
For example, if you want to know the historical growth of various types of communication technology, such as Telegraph, Radio, Telephone, Satellite and Internet, you can make a query on WheesBee patent database, extract data in Excel format and calculate the annual percentage growth rate related to the number of patents, as an indicator to analyze and compare the development of these technologies.
The following graph shows that:
- Telegraph communication had a great development in the 20s and 30s and then gradually disappeared from the international scene
- Radio communication had an initial development in 40s and 50s and a great development from 80s to 2000
- Telephone communication had had a more constant development from the 60s to 2000
- Satellite had a big impact on the communications since 70s
- Internet is the undisputed protagonist in the development of communications from 2000 onwards
